grafana
(a) Access to the Web Page
Access to http://127.0.0.1:3000/ with the machine's browser on the same network as DB machine,
and you can see the web page as follows:
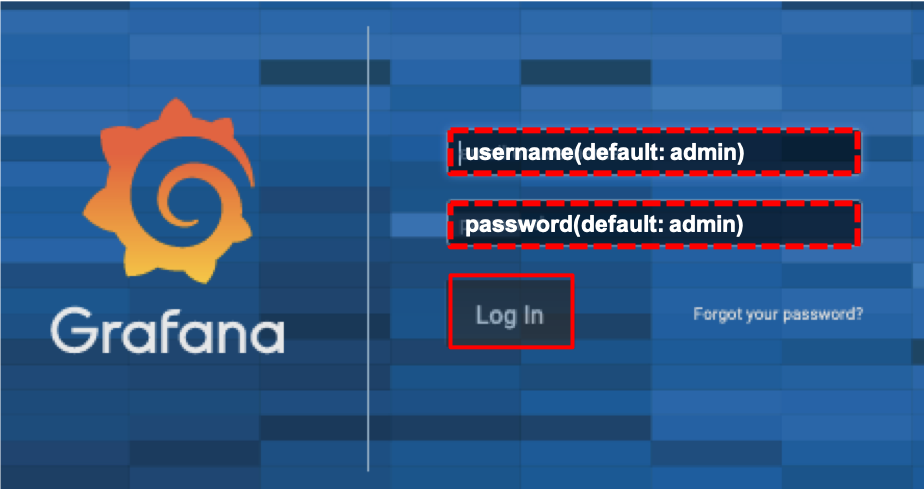
(b) Login
Login with the username: 'admin' and the password: 'admin'
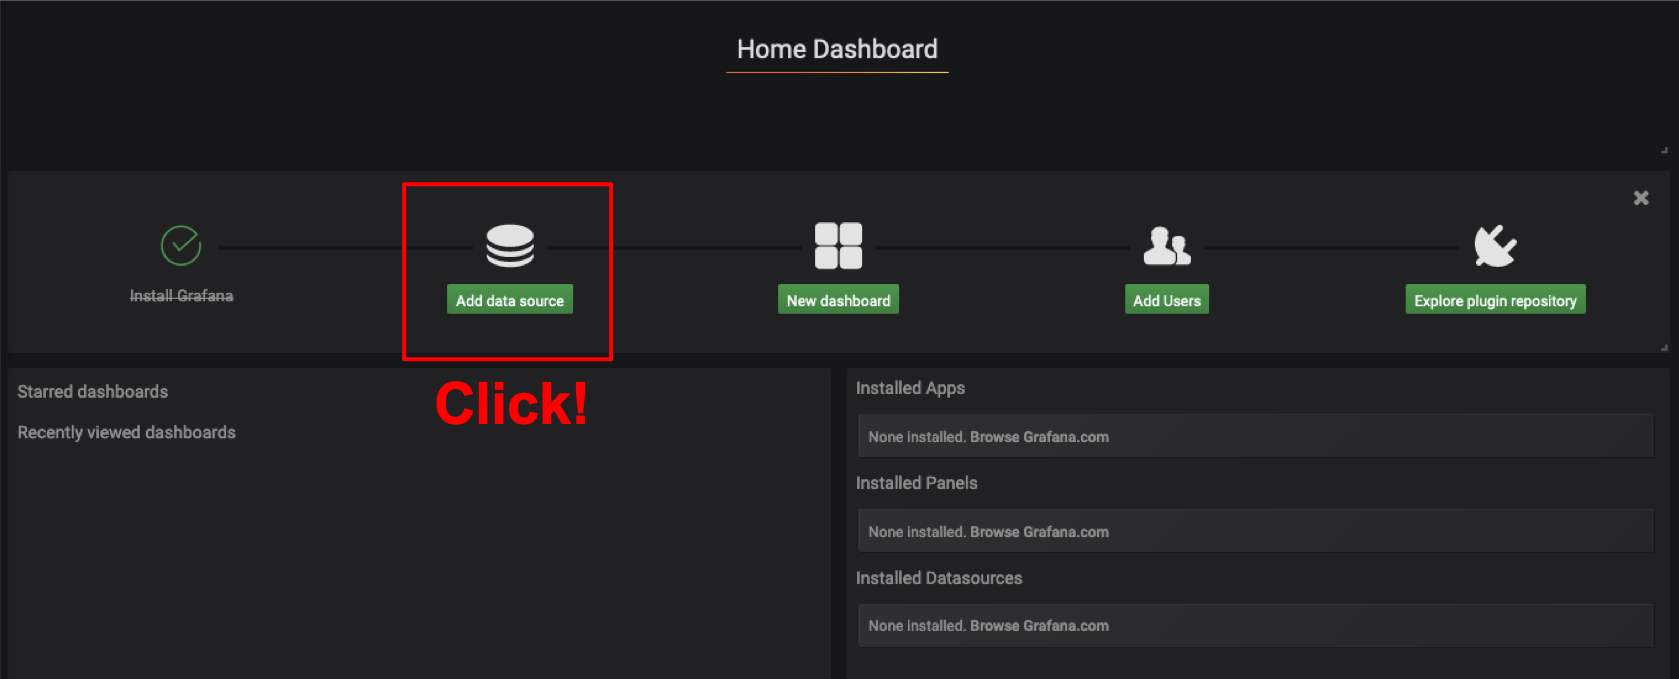
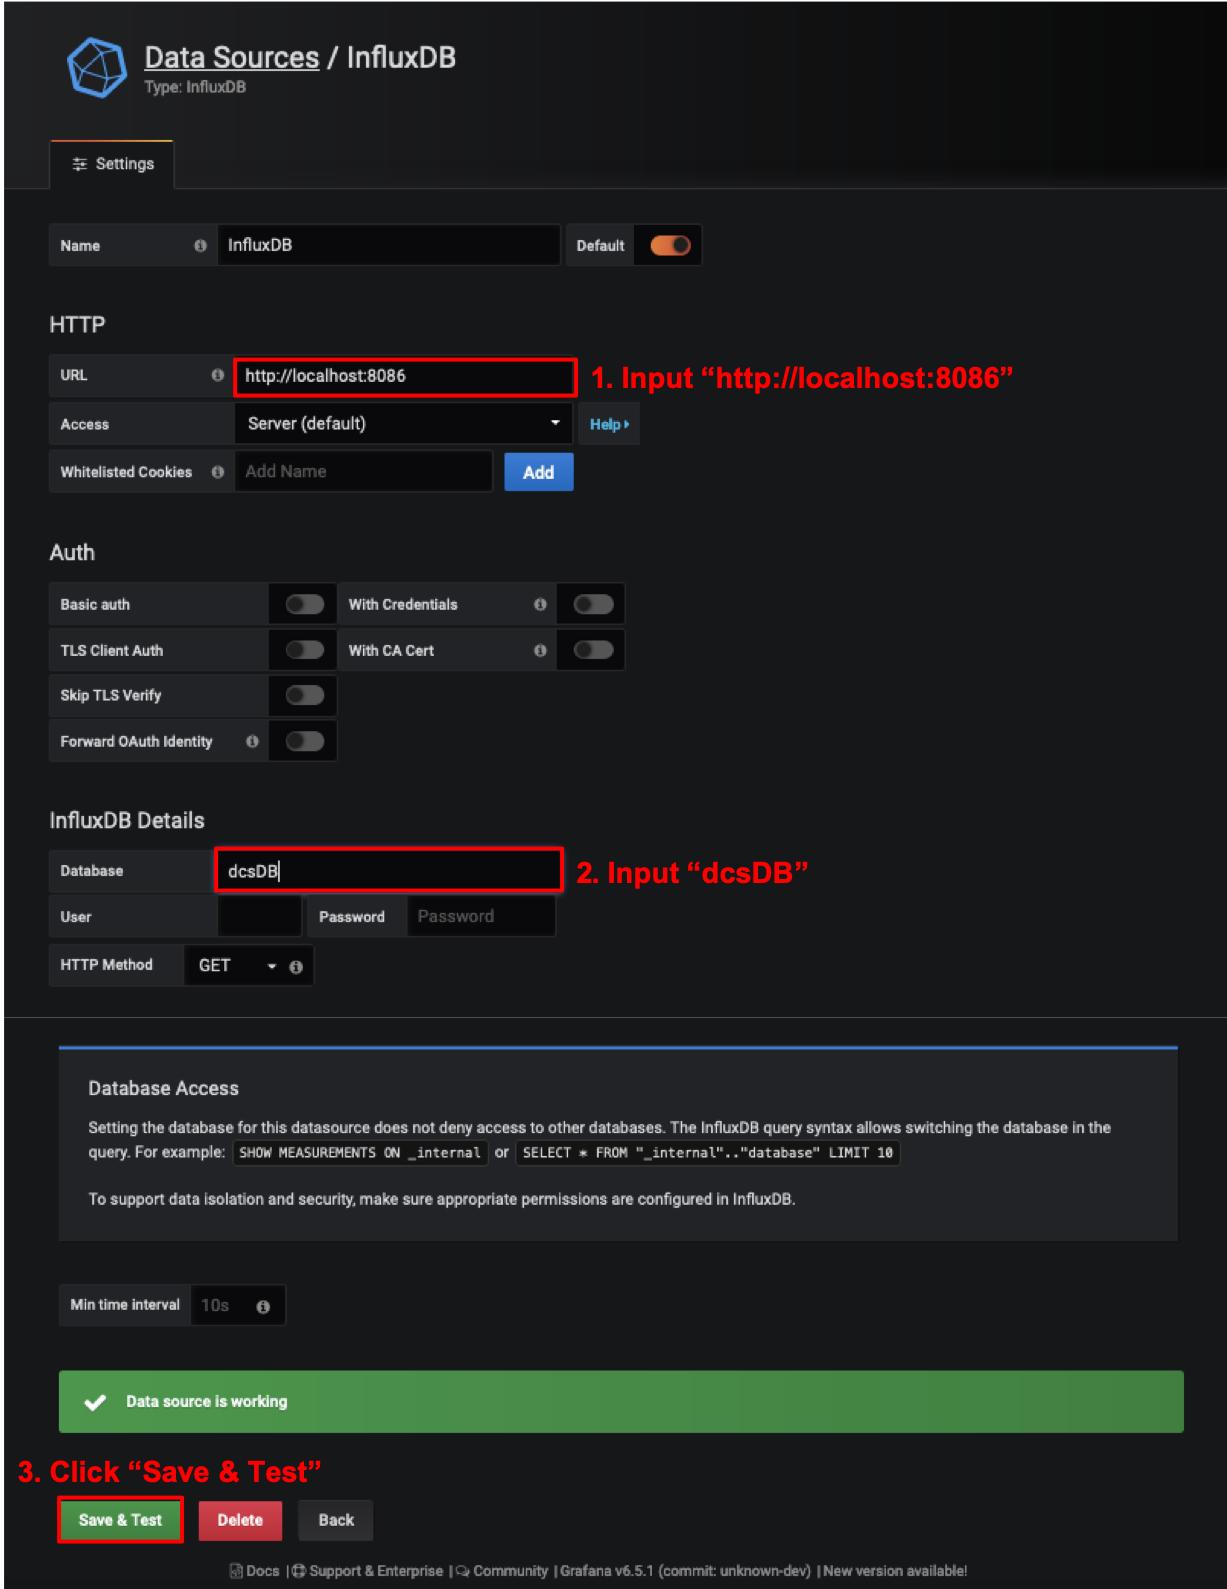
(c) Add Database Source
- Click "Add data source"
- Click "InfluxDB"
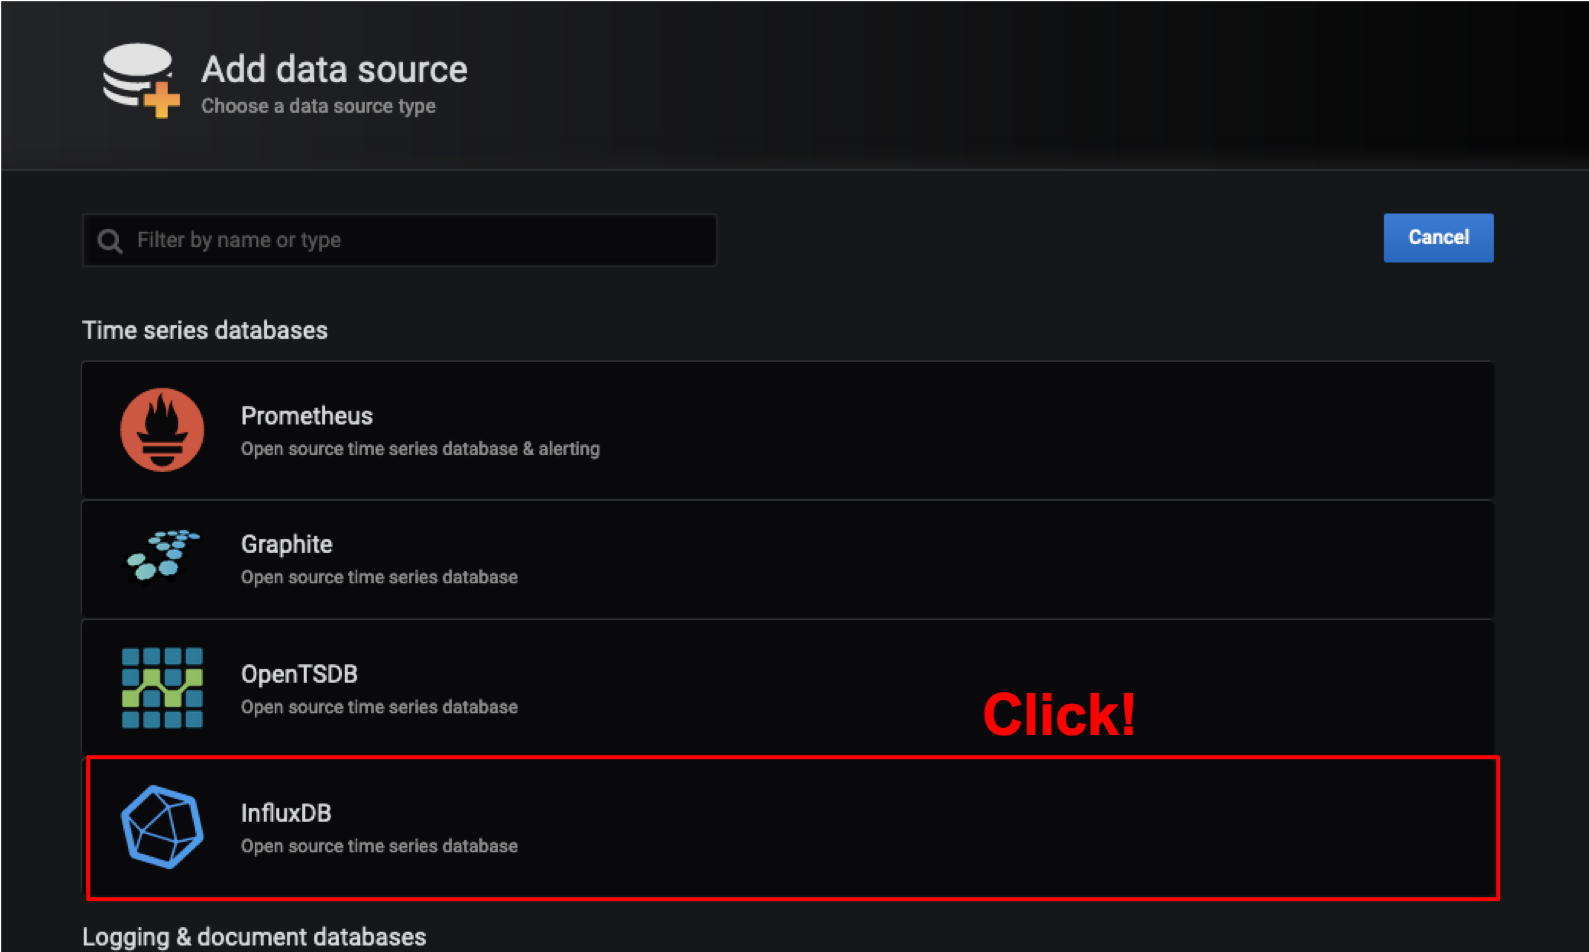
- Set URL "http://localhost:8086"
- Set Database "dcsDB"
- Click "Save & Test"
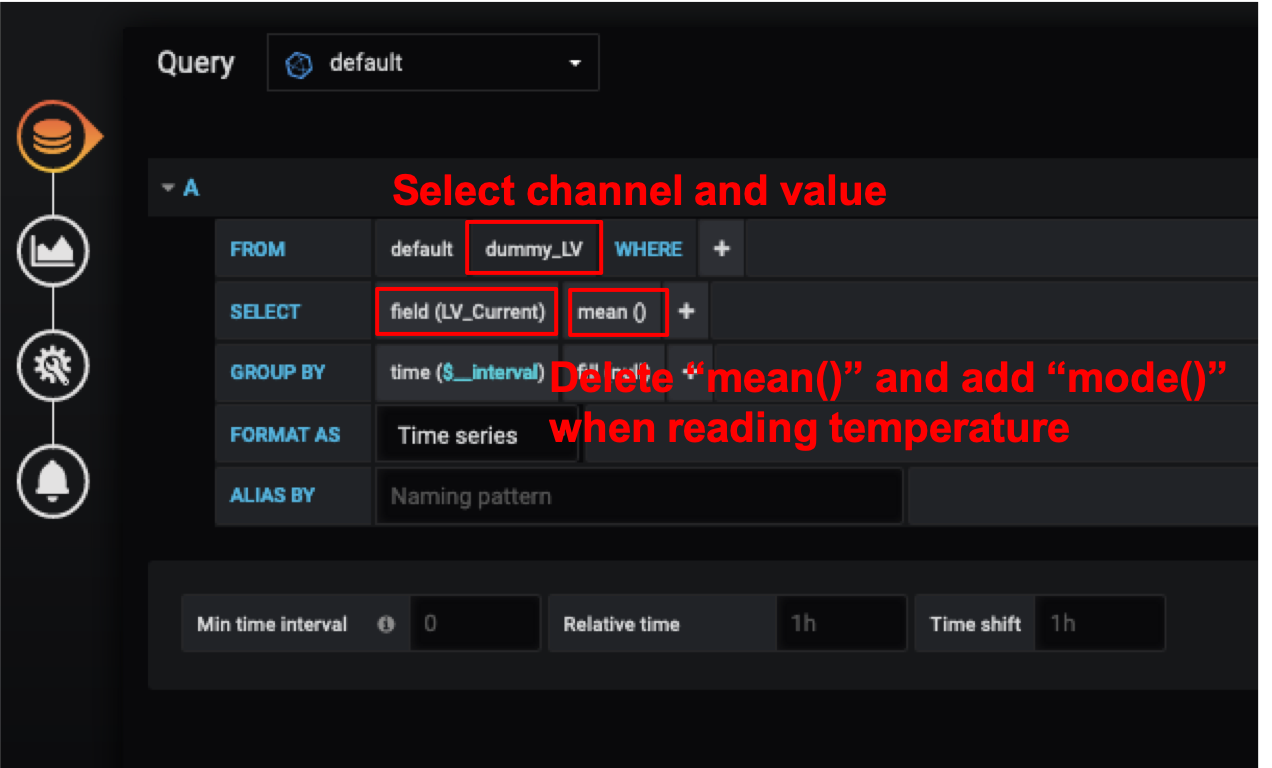
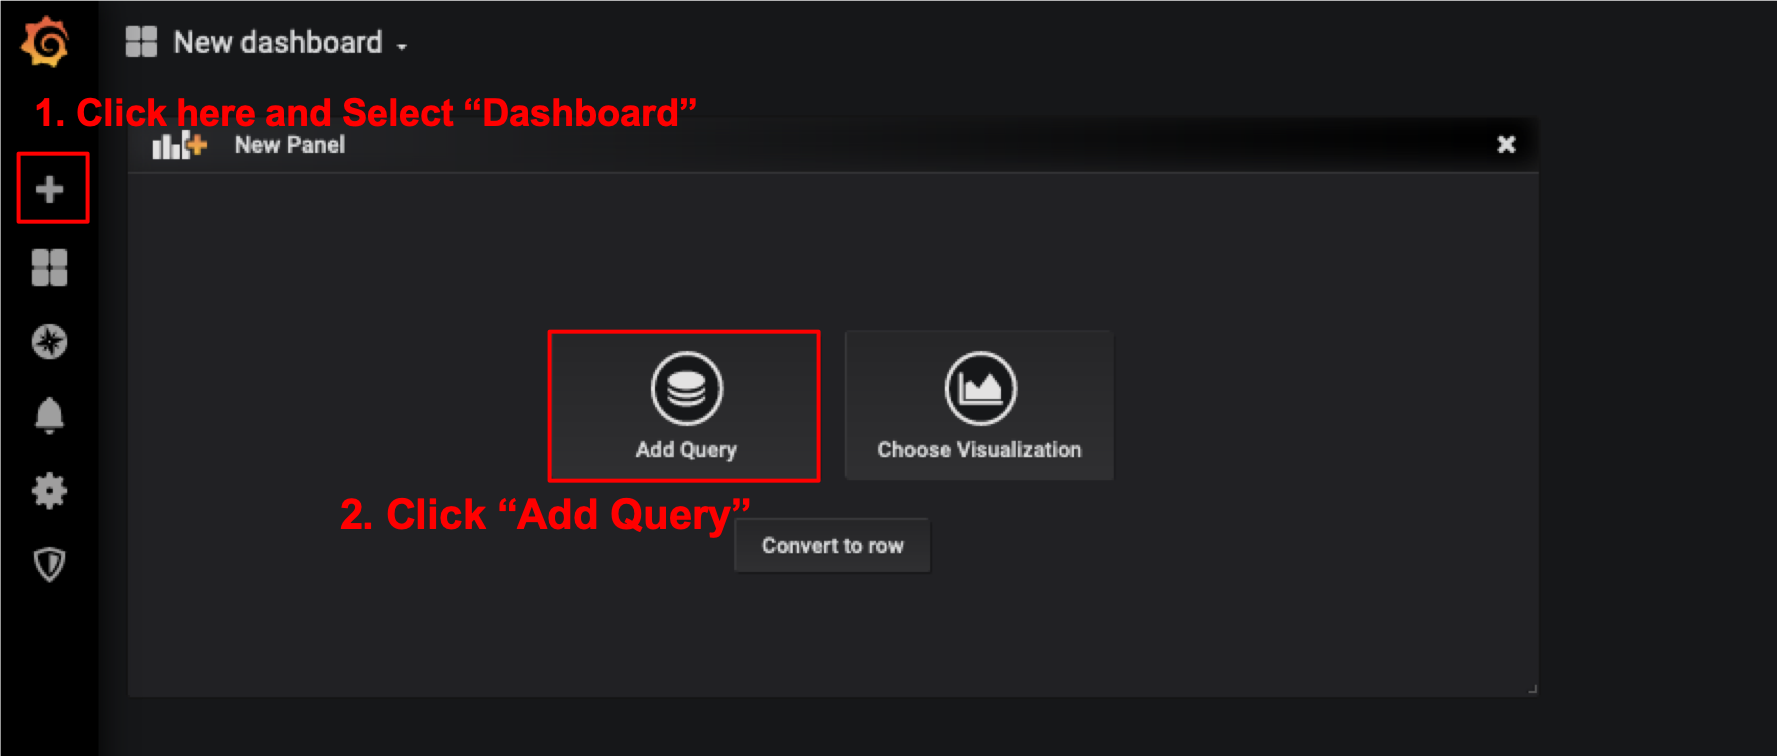
(d) Create New Dashboard
- Click "+"
- Click "Add Query"
- Select the measurement channel (e.g. "Tempareture")
- Select data value from the list (e.g. temp1)